Welcome to the Tidyverse
Hadley Wickham, Mara Averick, Jennifer Bryan, Winston Chang, Lucy D’Agostino McGowan, Romain François, Garrett Grolemund, Alex Hayes, Lionel Henry, Jim Hester, Max Kuhn, Thomas Lin Pedersen, Evan Miller, Stephan Milton Bache, Kirill Müller, Jeroen Ooms, David Robinson, Dana Paige Seidel, Vitalie Spinu, Kohske Takahashi, Davis Vaughan, Claus Wilke, Kara Woo, Hiroaki Yutani
19 November 2019
Source:vignettes/paper.Rmd
paper.RmdSummary
At a high level, the tidyverse is a language for solving data science challenges with R code. Its primary goal is to facilitate a conversation between a human and a computer about data. Less abstractly, the tidyverse is a collection of R packages that share a high-level design philosophy and low-level grammar and data structures, so that learning one package makes it easier to learn the next.
The tidyverse encompasses the repeated tasks at the heart of every data science project: data import, tidying, manipulation, visualisation, and programming. We expect that almost every project will use multiple domain-specific packages outside of the tidyverse: our goal is to provide tooling for the most common challenges; not to solve every possible problem. Notably, the tidyverse doesn’t include tools for statistical modelling or communication. These toolkits are critical for data science, but are so large that they merit separate treatment. The tidyverse package allows users to install all tidyverse packages with a single command.
There are a number of projects that are similar in scope to the tidyverse. The closest is perhaps Bioconductor (Gentleman et al. 2004; Huber et al. 2015), which provides an ecosystem of packages that support the analysis of high-throughput genomic data. The tidyverse has similar goals to R itself, but any comparison to the R Project (R Core Team 2019) is fundamentally challenging as the tidyverse is written in R, and relies on R for its infrastructure; there is no tidyverse without R! That said, the biggest difference is in priorities: base R is highly focussed on stability, whereas the tidyverse will make breaking changes in the search for better interfaces. Another closely related project is data.table (Dowle and Srinivasan 2019), which provides tools roughly equivalent to the combination of dplyr, tidyr, tibble, and readr. data.table prioritises concision and performance.
This paper describes the tidyverse package, the components of the tidyverse, and some of the underlying design principles. This is a lot of ground to cover in a brief paper, so we focus on a 50,000-foot view showing how all the pieces fit together with copious links to more detailed resources.
Tidyverse package
The tidyverse is a collection of packages that can easily be installed with a single “meta”-package, which is called “tidyverse”. This provides a convenient way of downloading and installing all tidyverse packages with a single R command:
install.packages("tidyverse")The core tidyverse includes the packages that you’re likely to use in everyday data analyses, and these are attached when you attach the tidyverse package:
library(tidyverse)
#> -- Attaching core tidyverse packages ------------ tidyverse 2.0.0 --
#> v dplyr     1.1.3     v readr     2.1.4
#> v forcats   1.0.0     v stringr   1.5.0
#> v ggplot2   3.4.4     v tibble    3.2.1
#> v lubridate 1.9.3     v tidyr     1.3.0
#> v purrr     1.0.2
#> -- Conflicts ------------------------------ tidyverse_conflicts() --
#> x dplyr::filter() masks stats::filter()
#> x dplyr::lag()    masks stats::lag()
#> i Use the conflicted package (<http://conflicted.r-lib.org/>) to force all conflicts to become errors
This is a convenient shortcut for attaching the core packages, produces a short report telling you which package versions you’re using, and succinctly informs you of any conflicts with previously loaded packages. As of tidyverse version 1.2.0, the core packages include dplyr (Wickham et al. 2019), forcats (Wickham 2019b), ggplot2 (Wickham 2016), purrr (Henry and Wickham 2019), readr (Wickham and Hester 2018), stringr (Wickham 2019d), tibble (Müller and Wickham 2018), and tidyr (Wickham and Henry 2019).
Non-core packages are installed with
install.packages("tidyverse"), but are not attached by
library(tidyverse). They play more specialised roles, so
will be attached by the analyst as needed. The non-core packages are:
blob (Wickham 2018a), feather (Wickham 2019a), jsonlite (Ooms 2014), glue (Hester
2018), googledrive (D’Agostino McGowan and
Bryan 2019), haven (Wickham and Miller
2018), hms (Müller 2018), lubridate
(Spinu, Grolemund, and Wickham 2018),
magrittr (Bache and Wickham 2014), modelr
(Wickham 2018b), readxl (Wickham and Bryan 2019), reprex (Bryan et al. 2019), rvest (Wickham 2019c), and xml2 (Wickham, Hester, and Ooms 2019).
The tidyverse package is designed with an eye for teaching:
install.packages("tidyverse") gets you a
“batteries-included” set of 87 packages (at time of writing). This large
set of dependencies means that it is not appropriate to use the
tidyverse package within another package; instead, we recommend that
package authors import only the specific packages that they use.
Components
How do the component packages of the tidyverse fit together? We use the model of data science tools from “R for Data Science” (Wickham and Grolemund 2017):
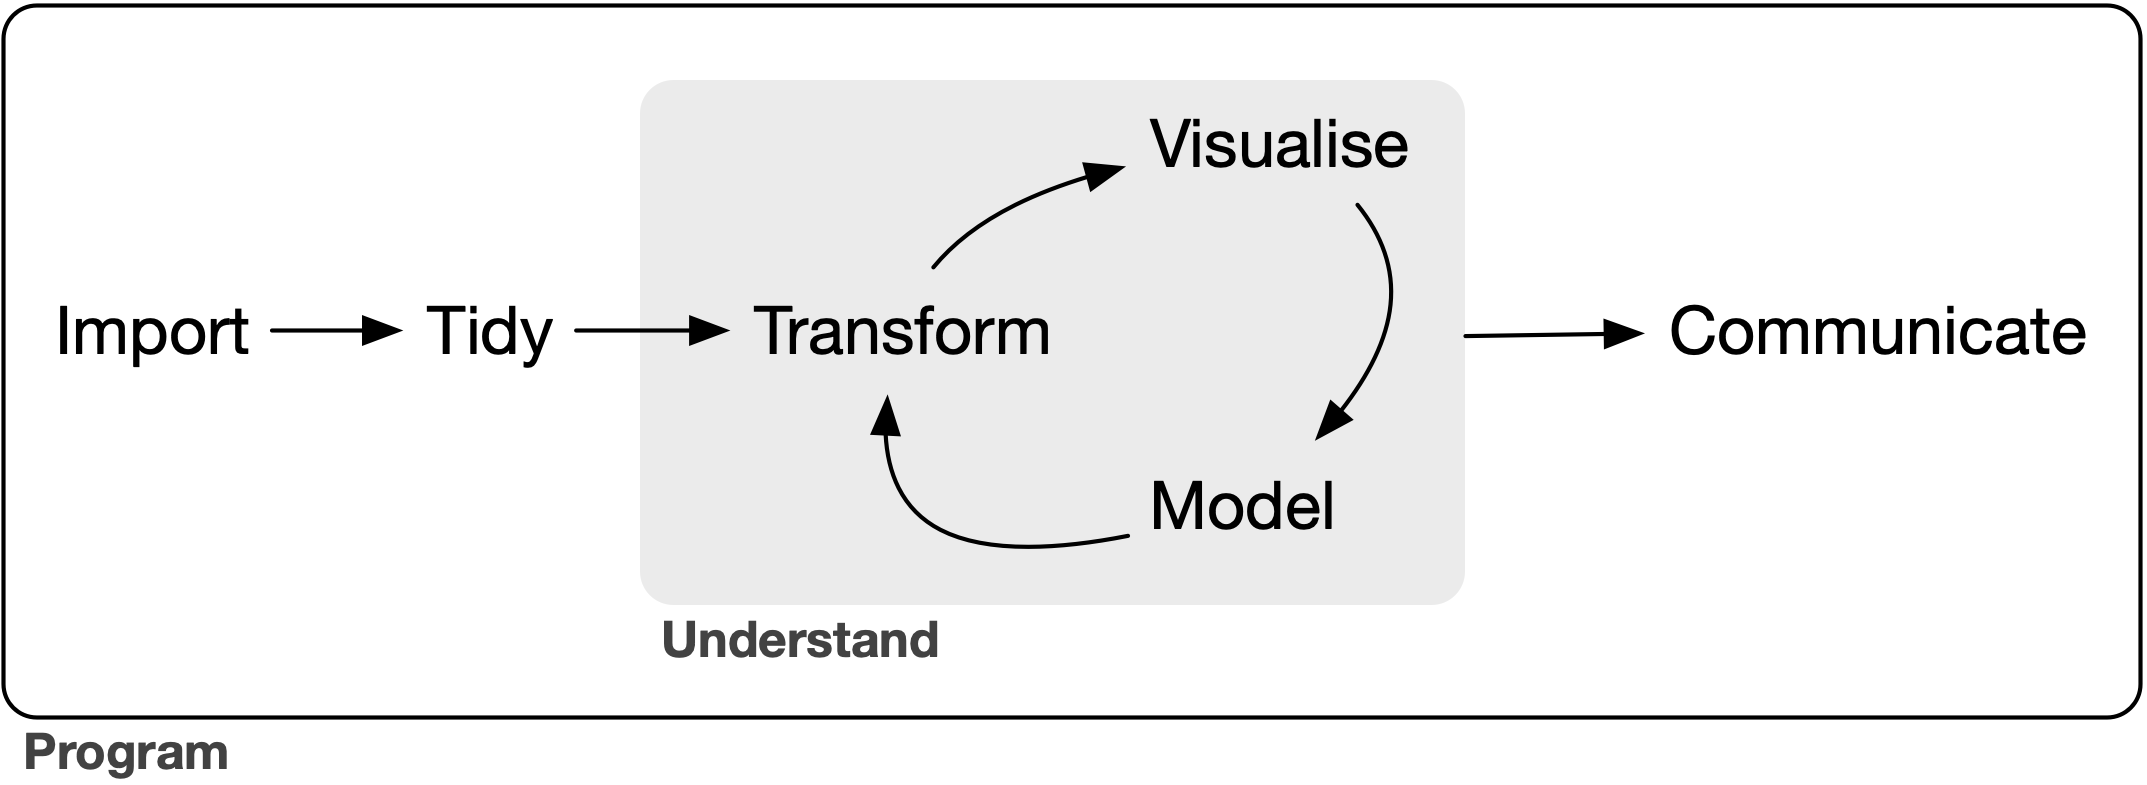
Every analysis starts with data import: if you can’t get your data into R, you can’t do data science on it! Data import takes data stored in a file, database, or behind a web API, and reads it into a data frame in R. Data import is supported by the core readr (Wickham and Hester 2018) package for tabular files (like csv, tsv, and fwf).
Additional non-core packages, such as readxl (Wickham and Bryan 2019), haven (Wickham and Miller 2018), googledrive (D’Agostino McGowan and Bryan 2019), and rvest (Wickham 2019c), make it possible to import data stored in other common formats or directly from the web.
Next, we recommend that you tidy your data, getting it into a consistent form that makes the rest of the analysis easier. Most functions in the tidyverse work with tidy data (Wickham 2014), where every column is a variable, every row is an observation, and every cell contains a single value. If your data is not already in this form (almost always!), the core tidyr (Wickham and Henry 2019) package provides tools to tidy it up.
Data transformation is supported by the core dplyr (Wickham et al. 2019) package. dplyr provides
verbs that work with whole data frames, such as mutate() to
create new variables, filter() to find observations
matching given criteria, and left_join() and friends to
combine multiple tables. dplyr is paired with packages that provide
tools for specific column types:
- stringr for strings.
- forcats for factors, R’s categorical data type.
- lubridate (Spinu, Grolemund, and Wickham 2018) for dates and date-times.
- hms (Müller 2018) for clock times.
There are two main tools for understanding data: visualisation and modelling. The tidyverse provides the ggplot2 (Wickham 2016) package for visualisation. ggplot2 is a system for declaratively creating graphics, based on The Grammar of Graphics (Wilkinson 2005).
You provide the data, tell ggplot2 how to map variables to aesthetics, what graphical primitives to use, and it takes care of the details. Modelling is outside the scope of this paper, but is part of the closely affiliated tidymodels (Kuhn and Wickham 2018) project, which shares interface design and data structures with the tidyverse.
Finally, you’ll need to communicate your results to someone else. Communication is one of the most important parts of data science, but is not included within tidyverse. Instead, we expect people will use other R packages, like rmarkdown (Allaire et al. 2018) and shiny (Chang et al. 2019), which support dozens of static and dynamic output formats.
Surrounding all these tools is programming. Programming is a cross-cutting tool that you use in every part of a data science project. Programming tools in the tidyverse include:
purrr (Henry and Wickham 2019), which enhances R’s functional programming toolkit.
tibble (Müller and Wickham 2018), which provides a modern re-imagining of the venerable data frame, keeping what time has proven to be effective, and throwing out what it has not.
reprex (Bryan et al. 2019), which helps programmers get help when they get stuck by easing the creation of reproducible examples.
magrittr (Bache and Wickham 2014), which provides the pipe operator,
%>%, used throughout the tidyverse. The pipe is a tool for function composition, making it easier to solve large problems by breaking them into small pieces.
Design principles
We are still working to explicitly describe the unifying principles that make the tidyverse consistent, but you can read our latest thoughts at https://design.tidyverse.org/. There is one particularly important principle that we want to call out here: the tidyverse is fundamentally human centred. That is, the tidyverse is designed to support the activities of a human data analyst, so to be effective tool builders, we must explicitly recognise and acknowledge the strengths and weaknesses of human cognition.
This is particularly important for R, because it’s a language that’s used primarily by non-programmers, and we want to make it as easy as possible for first-time and end-user programmers to learn the tidyverse. We believe deeply in the motivations that lead to the creation of S: “to turn ideas into software, quickly and faithfully” (Chambers 1998). This means that we spend a lot of time thinking about interface design, and have recently started experimenting with surveys to help guide interface choices.
Similarly, the tidyverse is not just the collection of packages — it is also the community of people who use them. We want the tidyverse to be a diverse, inclusive, and welcoming community. We are still developing our skills in this area, but our existing approaches include active use of Twitter to solicit feedback, announce updates, and generally listen to the community. We also keep users apprised of major upcoming changes through the tidyverse blog, run developer days, and support lively discussions on RStudio community.
Acknowledgments
The tidyverse would not be possible without the immense work of the R-core team who maintain the R language and we are deeply indebted to them. We are also grateful for the financial support of RStudio, Inc (now Posit Software, PBC).